
Sunday, November 11, 2012


Nifty outlook for 11-11-2012 ( daily and Weekly)
Nifty ended the day on negative note at 5686 levels by losing 52 points. After opening seven points lower at 5731 levels, Nifty rose higher and made day’s high at 5751 levels in an early trade. Thereafter, witnessing continuous selling pressure, Nifty slipped at day’s low at 5677 levels.
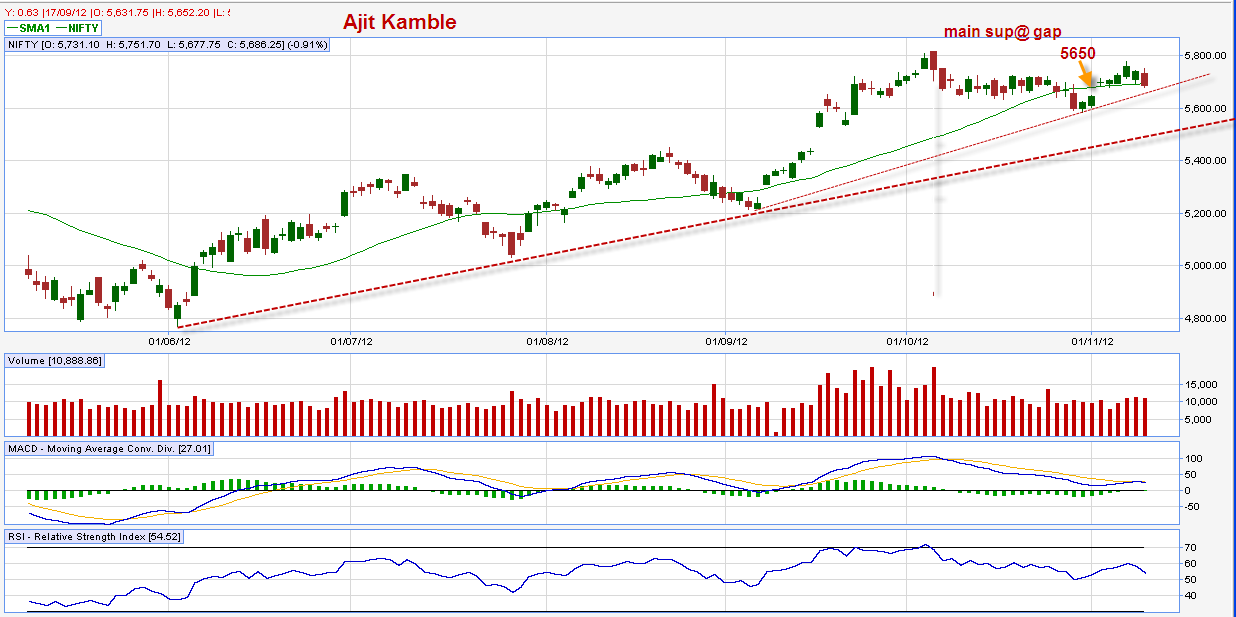
The formation of “Red” candle with higher upper shadow on daily chart which implies selling pressure indicates weakness in the market. In case, if Nifty fails to hold 5710 levels which is acting as important resistance levels of the day as 50% correction levels of ”Red” candle then weakness will persist further i.e. below 5680 it will lead 5640 and below that 5600 levels. On the contrary, if Nifty succeeds to hold and sustains above 5710 levels then bearish effect will get nullify and market will test 5800 levels in coming session.
The level of 5650 will act as trend decider levels. A sustainable move above this levels will lead pullback rally in the market. However, failure to trade above this levels will lead further fall in our view.
Support 1) 5650 2) 5610
Resistance 1) 5710 2) 5750
Weekly Outlook
Nifty ended the week 11 point lower at 5686 levels against previous weeks 5697 levels. Mid cap index rose 0.23% and Small Cap index gained 0.07%. Both indices outperformed the market.

On Weekly chart, Nifty has formed small body “High wave” pattern with higher upper shadow. This indicates that the market is having difficulty coming to a consensus on security’s value. It means this indicates indecisive nature of market as neither buyer nor the sellers have a clear sense of the direction where demand and supply are equally balanced. In this kind of scenario, the level of 5720 on higher side and 5640 on lower side remains important levels to watch for the week. If Nifty manages to hold and sustains above 5720 levels then trend will remain positive. In that case Nifty will test 5820 levels in coming session. On the other hand, if Nifty fails to hold and remains below 5640 levels for the week then trend will remains negative. In that case, Nifty’s possibility of violating 5500 marks can not be ruled out.
The level of 5370 will act as trend decider level for the day. A sustainable move above this level will lead continuation in upward rally in Nifty. However, failure to trade above this level will lead at least intraday correction around 5340-30 levels in Nifty.
Weeky
Support :- 1) 5630 2) 5550
Resistance :- 1) 5730 2) 5820
Tuesday, November 6, 2012
Nifty Outlook for 07-11-2012
Nifty gained marginal strength amid volatility in late trade following up move in European markets ahead of US Presidential Elections. Nifty closed 20 points higher at 5724.20 levels against previous day closing 5704.20 after witnessing days low at 5693.65 levels. It made days high at 5730.80 levels before close.

On daily chart, Nifty has formed a Bullish candle with upper shadow against previous day’s bull candle. It also has maintained the previous gap ( 5649 to 5679 levels which formed on 1st November). This indicates bullish sentiment but never negates the possibility of profit booking on higher levels. In this case, the levels of 5750 will act as important levels to watch. If Nifty manage to hold 5740 levels and sustains above 5750 levels for the day then we will see further extension in the trend. In that case, Nifty will test 5820 levels in coming session in our view. On the contrary, failure to do so will result in profit booking which will lead downward correction in Nifty. In that case, Nifty’s possibility of testing 5660 or lower levels in intraday trade can not be ruled out.
The level of 5750 will act as trend decider level for the day. A sustainable move above this level will lead continuation in upward rally in Nifty. However, failure to trade above this level will lead at least intraday correction around 5660-30 levels in Nifty.
Daily
Support :- 1) 5700 2) 5660
Resistance :- 1) 5750 2) 5790
Tuesday, July 17, 2012

We were watching 5220 level as an important level for the day and were expecting fall around 5160-70 levels once it fails to hold. Nifty slipped below last four day’s low at 5181 levels despite opening higher by 31 point. After opening higher, Nifty restricted its trade below first resistance level by recording day’s high at 5236 levels and fell down at main psychological level of 5200 mark. From that level, Nifty tried to rise but failed and slipped down at 5181 levels. At the end, Nifty closed at 5192 with minor loss of 4 point.
Nifty has formed another bearish candle but with almost equal upper and lower tail, implying equal force of buyer and sellers. This could be indicatives of temporary pullback from lower levels. In this case, the level of 5160 which is acting as main support for the day as previous “rising” gap area remains important to watch. On fifth Fibonacci day, if Nifty succeeds to hold and sustain above 5160 levels for the day then we will see rise in Nifty. In that case, Nifty will test 5250 and above that 5280 levels in our view. On the contrary, if Nifty fails to hold and remains below 5160 levels then it will continue the downward correction around said area at 5050 levels in coming session.
(Over all…. The bias seems to be negative as long as Nifty remains below 5300 levels which is acting as important resistance levels as falling gap area. In that case, Nifty’s possibility of testing 5000 mark will remains wide open. )
The level of 5160 will act as trend decider level for the day. A sustainable move above this level will lead temporary pullback in Nifty. However, failure to trade above this level will continue the fall.
Daily
Support :- 1) 5160 2) 5120
Resistance :- 1) 5230 2) 5270
Weekly
Support :- 1) 5180 2) 5080
Resistance :- 1) 5300 2) 5400
Monday, July 16, 2012
We said that if Nifty fails to trade above 5240 and remains below 5220 levels then it will fall down below 5200 at 5160-70 levels. Yesterday, Nifty opened higher but after testing days high at 5246 levels, it could not maintained the momentum as a result it slipped down below 5200 marks at day’s low at 5190 levels. At the end, Nifty closed with 30 points loss at 5197 levels.

On daily chart, Nifty has formed another bearish candle with higher upper tail indicating selling pressure on higher levels. This indicates further weakness in the trend. In case, if Nifty fails to hold above 5220 and remains below 5200 then weakness will persist further. In that case, Nifty will see fall around 5160-70 levels as we said before. On the other hand, if Nifty manages to hold and sustain above 5200 levels then it will lead pullback at 5230 levels.
(Over all…. The bias seems to be negative as long as Nifty remains below 5300 levels which is acting as important resistance levels as falling gap area. In that case, Nifty’s possibility of testing 5000 mark will remains wide open. )
The level of 5200 will act as trend decider level for the day. A sustainable move above this level will lead rise in Nifty. However, failure to trade above this level will lead fall around 5160-70 levels.
Daily
Support :- 1) 5170 2) 5140
Resistance :- 1) 5230 2) 5270
Wednesday, May 23, 2012
Long term view on Nifty
I have predicted 4200 levels in Nifty ( possible wave count)... the wave which i predicted as C ( could be terminal impulse) actually seems to be wave X ( 5605)...the current fall from that levels could be new wave structure ( only applicable if 4500 gets hold)........but as per rule of Triangle, "c" wave ( from 6338) have to retrace 50% of wave "B" which comes @ 4200-4300..(max its can fall @ 3600-3800)....
 Over all, holding above 4680 will lead 5200 in coming days....After that it will fall back to 4200 levels in my view...
Subscribe to:
Posts (Atom)
As of now , we considered the fall from 12440 to 7500 levels as wave A of triangle. When wave B exceeds 1.236% of wave A then it could...

-
 As of now , we considered the fall from 12440 to 7500 levels as wave A of triangle. When wave B exceeds 1.236% of wave A then it could...
 -
 Nifty ended the day on negative note at 5686 levels by losing 52 points. After opening seven points lower at 5731 levels, Nifty rose highe...
